Optimization Odyssey: pprof-ing & Benchmarking Golang App
In this post, I want to guide you through the whole process of profiling and benchmarking the Golang app. I will create a simple server app with the most naive implementation of it and will show you the step-by-step process of finding slow spots in your application with the help of the pprof profiling tool.
But before we get started, I want to emphasize something for you:
Never engage in premature optimizations.
Usually, the naive approach to the problem is the best and safest. In the real world, outside Leetcode, your employer wants you to ship fast, not spending much time on optimizing nanosecond executions. Yes, there are some optimizations you still need to perform (like solving N+1 mysteries), but they are most likely to be business logic optimizations not covered in this post.
Do fine-tune optimizations and benchmarking only when necessary or if you expect to see some massive load on this part of the code. Your 0.1 RPS app does not need this, believe me 🙂
Stage 1: The Naive Approach.
OK, so before we deep dive into the pprof profiling, let's create our elementary project first. I will create some server app with just one route that will iterate over the large JSON array to return some summary. The dummy data array will consist of some fictional data objects of users' transactions and bank accounts; the app will need to iterate over the array and sum up those numbers. For the server, I will choose gin since it is the most popular tool currently, and for calculating money amounts I will choose shopspring/decimal.
Everything I mentioned here in this article is available for you in the GitHub repository: samgozman/golang-optimization-stages. At this point, you can safely skip Stage 1 and go directly to the next chapter.
The main function will be ServeApp and you can find the source code for it here: samgozman/golang-optimization-stages/blob/main/stage1/main.go. Nothing special about it, just a classic gin server with context shutdown. Let's keep attention on the part that will do some work, in our case the router handler GetJSONHandler:
// GetJSONHandler is a simple handler that returns a JSON response with a message
func GetJSONHandler(c *gin.Context) {
  // 1. Read the content of the file dummy_data.json
  data := ReadFile("../object/dummy_data.json")

  // 2. Return a JSON response with a message
  users := ParseJSON(data)

  // 3. Calculate the total balances
  currents, pendings := BalancesTotals(users)

  // 4. Calculate the total transactions
  transactionsSum, transactionsCount := TransactionsTotals(users)

  c.JSON(200, gin.H{
    "current":            currents.String(),
    "pending":            pendings.String(),
    "transactions_sum":   transactionsSum.String(),
    "transactions_count": transactionsCount,
  })
}
It consists of 4 major functions: ReadFile, ParseJSON, BalancesTotals and TransactionsTotals.
// ReadFile reads a file and returns its content as a string
func ReadFile(filePath string) []byte {
  content, err := os.ReadFile(filePath)
  if err != nil {
    panic(fmt.Errorf("failed to read file: %w", err))
  }
  return content
}

func ParseJSON(data []byte) []object.User {
  var users []object.User
  if err := json.Unmarshal(data, &users); err != nil {
    panic(fmt.Errorf("failed to unmarshal JSON: %w", err))
  }

  return users
}

// BalancesTotals calculates the total balances of the users.
func BalancesTotals(users []object.User) (currents decimal.Decimal, pendings decimal.Decimal) {
  for _, user := range users {
    current, _ := decimal.NewFromString(user.Balance.Current)
    currents = currents.Add(current)

    pending, _ := decimal.NewFromString(user.Balance.Pending)
    pendings = pendings.Add(pending)
  }

  return
}

// TransactionsTotals calculates the total transactions of the users.
func TransactionsTotals(users []object.User) (sum decimal.Decimal, count int) {
  var transactionsSum decimal.Decimal
  var transactionsCount int

  for _, user := range users {
    for _, transaction := range user.Transactions {
      amount, _ := decimal.NewFromString(transaction.Amount)
      transactionsSum = transactionsSum.Add(amount)
      transactionsCount++
    }
  }

  return transactionsSum, transactionsCount
}
Doesn't really matter what fields are in object object.User for this purpose. The main thing you should know is that it is a big structure and the array size is ~1.8 MB on the disk.
I think that you can find already just a few spots that could be done more efficiently, like using a pointer to the structure, combining BalancesTotals and TransactionsTotals, reducing the Big O complexity (nested for-loops), or counting transactions with len().
It would be fantastic if you could spot those things. However, it is not the best approach for an optimization process because you are not sure which changes will have the biggest impact. And do they have a positive impact at all? Will this be enough?
How to Im'pprof' our code: the guide into Golang profiling tool.
To start the optimization process, we first need to prioritize our targets. To do so, we need to find the slowest parts of our application and the most memory-inefficient parts of it. This where the pprof tool comes in.
pprof, or performance profiler, is a tool that helps you to collect CPU profiles, traces, and memory heap profiles of your Golang application. It also comes with features to analyze and visualize generated pprof reports (but this will require graphviz installed).
There are a few techniques of how you can capture profiles from your app:
- By manually calling the
pproftool in your code (in the benchmarking process) - By running
pprofAPI router alongside of your application, which is just one line of code with the help of standard librarynet/http/pprof.
I will go with the first approach for this article because it can show you more of how you can use this tool. And you will not always be able to set up a pprof API comfortably in your application (if you are building some desktop application or a CLI tool for instance).
Now, back to the code! We need to create some very basic tests for the app, but in the case of profiling, I would recommend going with the benchmark test type.
func BenchmarkServeApp(b *testing.B) {
  // Start pprof profiling
  if err := utils.StartPprof(); err != nil {
    log.Fatal(err)
  }

  // Create a context
  ctx, cancel := context.WithCancel(context.Background())
  defer cancel()

  // Run the server
  go ServeApp(ctx)

  // Run the benchmark
  for i := 0; i < b.N; i++ {
    _, err := http.Get("http://localhost:8080/json")
    if err != nil {
      b.Fatal(err)
    }
  }

  // Cancel the context
  cancel()
}
I have moved pprof initialization to the utils.StartPprof, we will return to it in a bit. Normally, we would have to create a benchmark just for the router handler function GetJSONHandler, since it holds all the logic we are trying to optimize. But, for the educational approach, I will test the whole ServeApp - because you might want to replace gin router with something else to see if it improves any numbers.
To run the benchmark in Go, all you have to do, besides creating a test with b *testing.B as a parameter, is to run a console command:
go test -bench=.
As simple as that, but we will add some more parameters to it later on. Back to the profiling initialization function that I moved to have fewer repetitions between the steps in the repository for that post.
var cpuprofile = flag.String("cpuprofile", "", "write cpu profile to `file`")
var memprofile = flag.String("memprofile", "", "write memory profile to `file`")

// StartPprof starts pprof profiling
func StartPprof() error {
  flag.Parse()
  if *cpuprofile != "" {
    f, err := os.Create(*cpuprofile)
    if err != nil {
      return fmt.Errorf("could not create CPU profile: %w", err)
    }
    if err := pprof.StartCPUProfile(f); err != nil {
      _ = f.Close()
      return fmt.Errorf("could not start CPU profile: %w", err)
    }
    pprof.StopCPUProfile()
    if err := f.Close(); err != nil {
      return fmt.Errorf("could not close CPU profile file: %w", err)
    }
  }

  if *memprofile != "" {
    f, err := os.Create(*memprofile)
    if err != nil {
      return fmt.Errorf("could not create memory profile: %w", err)
    }
    runtime.GC() // get up-to-date statistics
    if err := pprof.WriteHeapProfile(f); err != nil {
      _ = f.Close()
      return fmt.Errorf("could not write memory profile: %w", err)
    }
    if err := f.Close(); err != nil {
      return fmt.Errorf("could not close memory profile file: %w", err)
    }
  }

  return nil
}
Ok, that's quite a lot of code! Remember, you can avoid writing this manually if you can "afford" to run a profiling router alongside your application. We are doing it this way not because we want just to optimize the app, but also to measure the results with controlled benchmarks.
Let's take a look at this code. First, we are getting the pprof options from the CLI. In the StartPprof we are creating 2 separate files for binary output data from pprof (btw, it is not just binary, it is basically a compiled Protobufs). In this case, we are trying to capture CPU and memory heap profiles. Pprof has a few more options you can trace, but those are the most common and important in my opinion to start with.
Remember that Golang has a garbage collector? Garbage collection is the process of finding and reclaiming memory that is no longer in use by your program. In Go, this is typically managed automatically, but here we are calling runtime.GC(), which is not the thing you will normally do in your application. The reason runtime.GC() is called before writing the memory profile is to ensure that the memory statistics are up-to-date. If there is any memory that can be reclaimed, runtime.GC() will do so, and then the memory profile will reflect the current state of memory usage after that cleanup.
In contrast, CPU profiling is about tracking where time is spent, rather than resources that are used. It records the function call stack at regular intervals during the period of profiling. This is why runtime.GC() is not called in the CPU profiling section - it's not relevant to the data being collected.
Capturing & reading performance profiles with pprof.
Everything is set up and ready for the first test! Let's proceed with the actual bech & profiling:
go test -v -cpuprofile=cpu.pprof -memprofile=mem.pprof -benchmem -bench=. -benchtime=1s -count=10
What it does is running our benchmark test with performance profile writing into mem.pprof and cpu.pprof files. The part I want you to keep attention to is those 2 flags:
-benchtime=1swill ensure we will run as many iterations as possible within 1 second. This will help to get fast results regarding your function RPS capabilities. You can also lock the number of iterations of your code to run instead of a timeout by setting5xas an argument (to run 5 times, for example).-count=10is how many times we will repeat our benchmark. For fast 1s benchmarks, I recommend you to run at least 10 times to get some average values. Depending on many things in your system, each run will not be the same. This is why it is recommended to run benchmarks in some dedicated server environment with as few background processes as possible to get reliable results.
After running this command, you will get this output (your actual numbers will vary):
BenchmarkServeApp-10   75   15359607 ns/op   5022236 B/op   63424 allocs/op
BenchmarkServeApp-10   79   15283220 ns/op   5019885 B/op   63420 allocs/op
...
It is a lot of information and is not that readable at the first glance (I don't know why the go-team forgot to add some headers here, but anyway). You can manually average down those values or to run longer tests (also benchmark iterations can be compared automatically by the CLI tool, but I will address it later). Let's take a look at how we can read those values:
- BenchmarkServeApp-10 - The
-10indicates the envGOMAXPROCSvalue, which is the maximum number of CPUs that can be executing simultaneously. - 75, 79, etc.: These are the number of iterations that the benchmark was able to run in the time specified by
-benchtime(1 second in our case). - 15359607 ns/op, 15283220 ns/op, etc.: This is the average time taken per operation, in nanoseconds. An "operation" is one iteration of your benchmark function.
- 5022236 B/op, 5019885 B/op, etc.: This is the average amount of memory allocated per operation, in bytes. This includes both heap and stack memory.
- 63424 allocs/op, 63420 allocs/op, etc.: This is the average number of memory allocations made per operation.
Now that you understand how to read Golang benchmark values, it is time for the next part: reading mem.pprof and cpu.pprof profiles.
Small reminder - graphviz installation required.
I will start from the mem.pprof, since it is impossible to open them both with one command. To do so, run this command and head into the browser:
go tool pprof -http=':8081' mem.pprof
Open the URL provided in the console to access pprof UI. Before you will be overwhelmed with the chart, let's look at the menu. In the "Sample" section, there are 4 options available: alloc_objects, alloc_space, inuse_objects and inuse_space. I think it is obvious from the name what each sample group represents. The group that is interested the most to me is alloc_space - click on it.
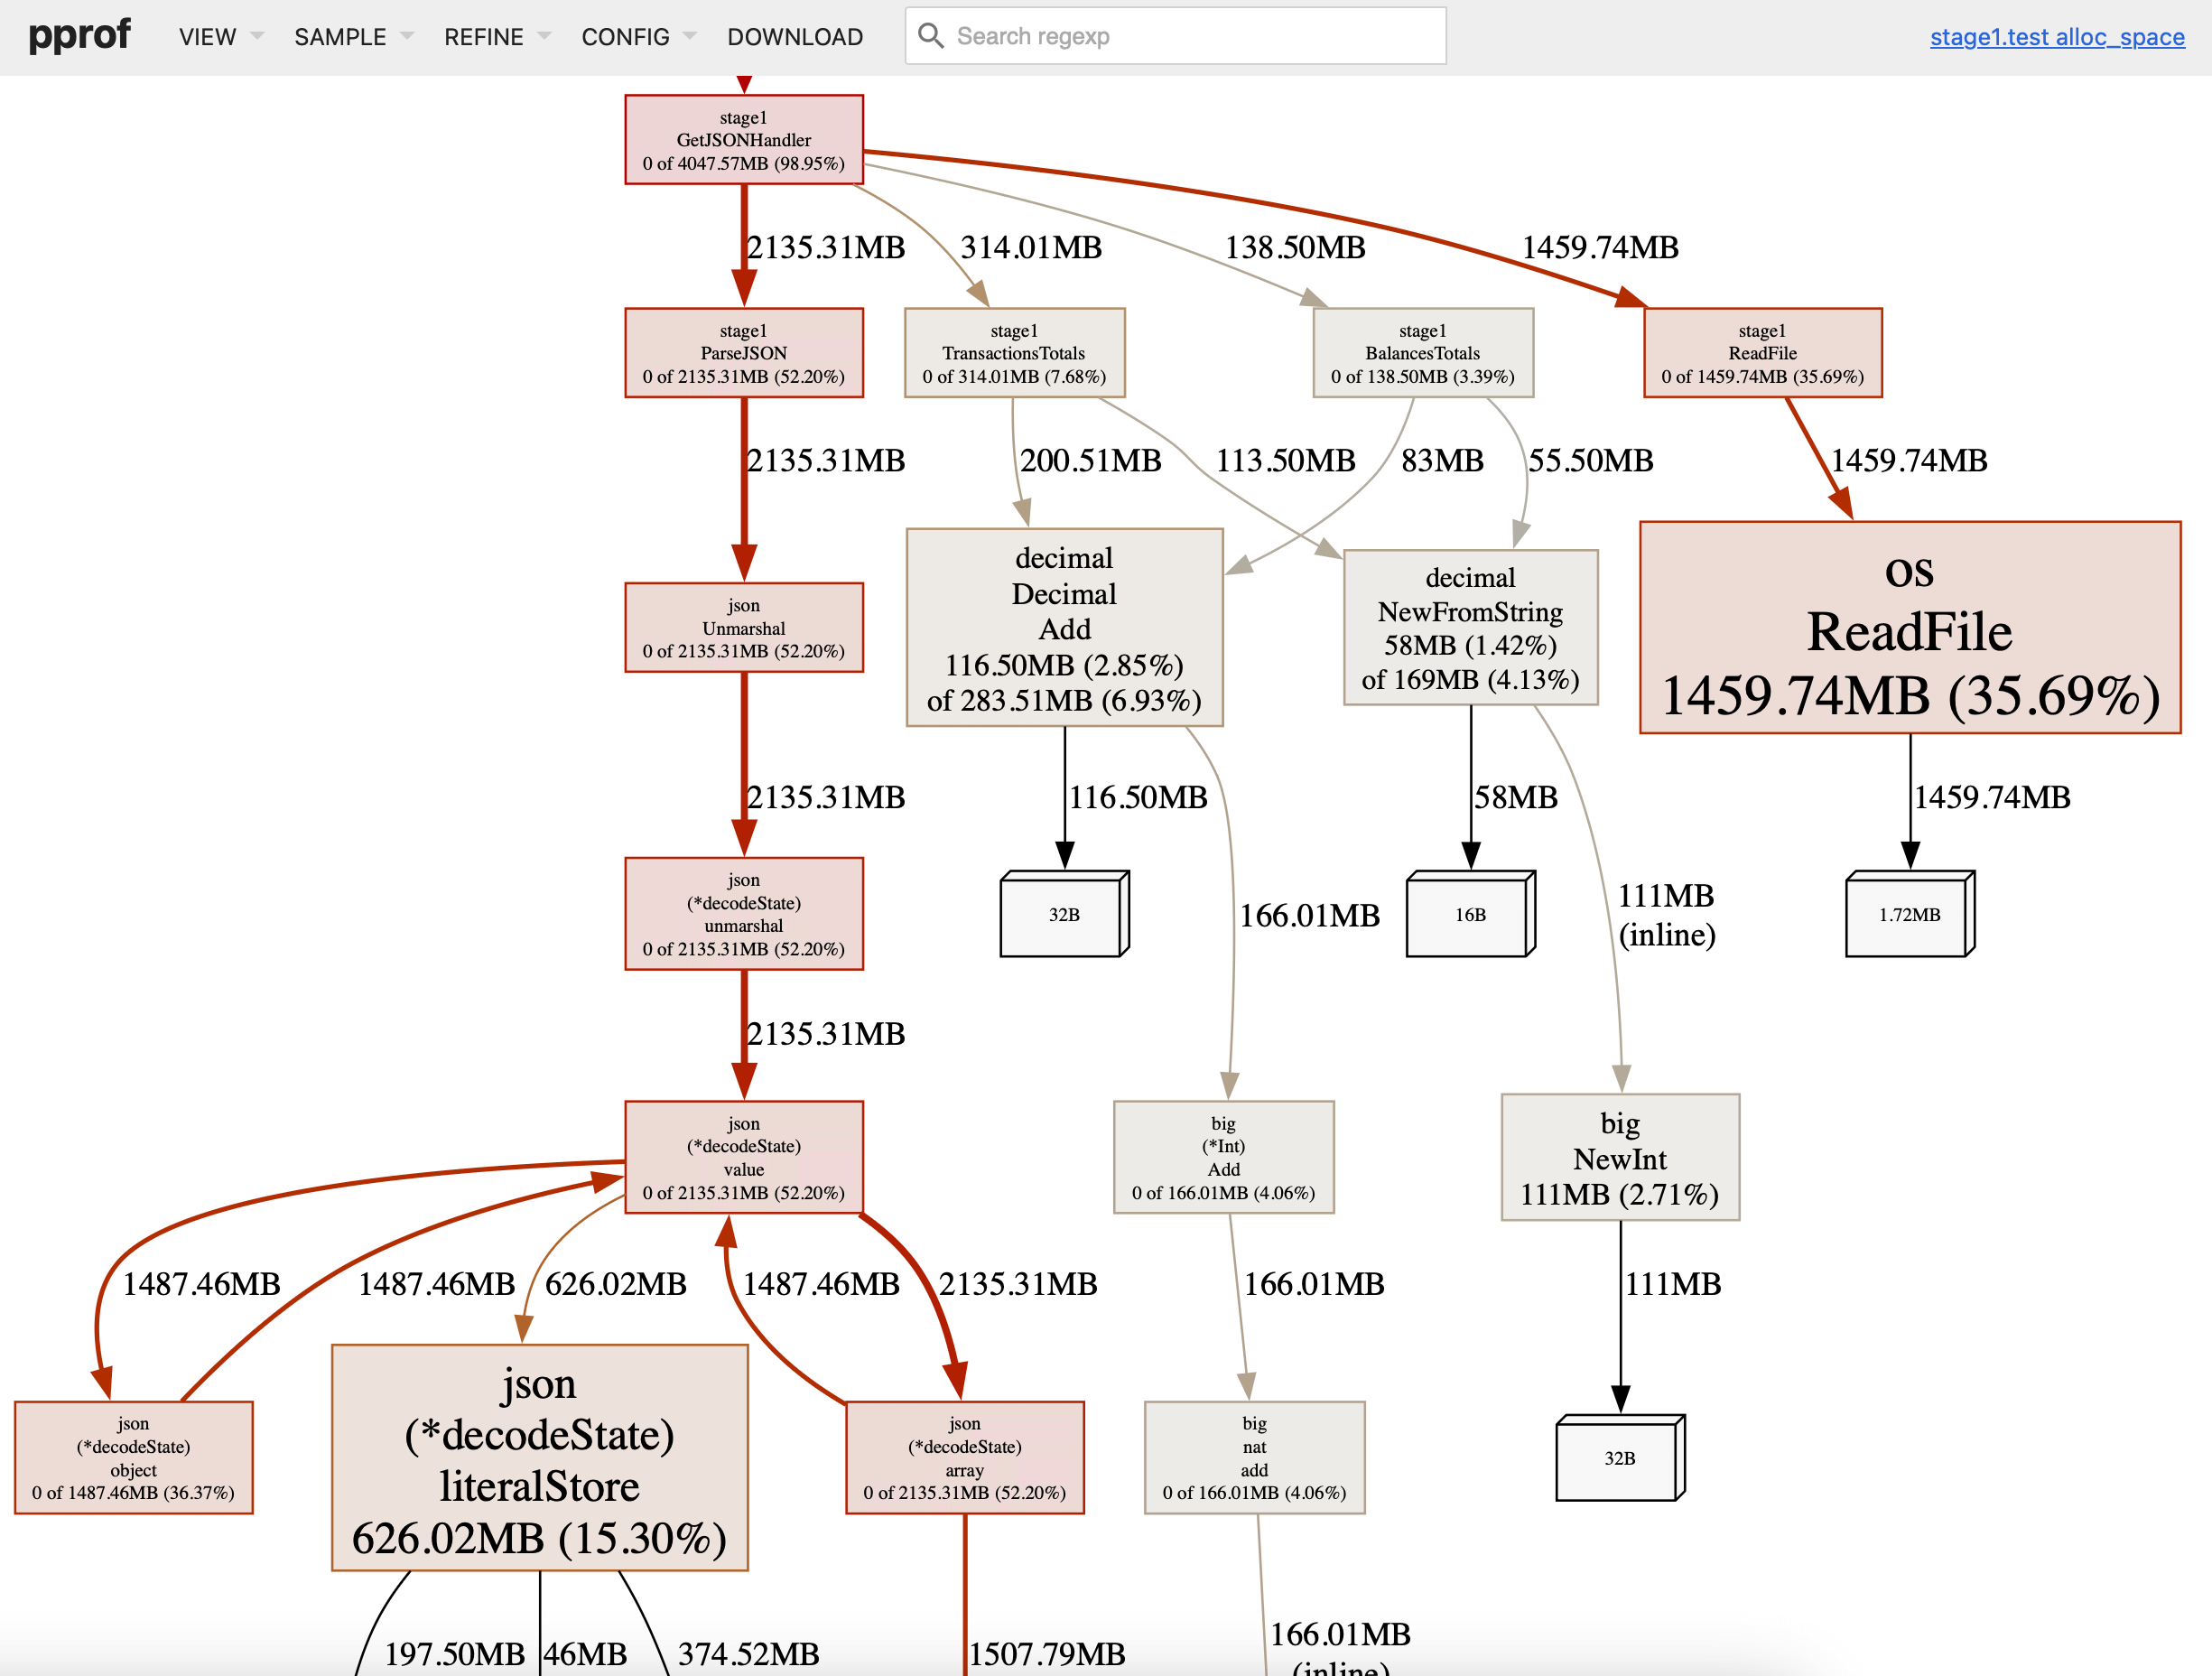
What you see here is a call stack of functions used in our app and the libraries inside it. Just by looking at this graph view, you can already notice what functions allocated the most space during execution. We had only 4 functions in GetJSONHandler where ParseJSON with ReadFile is draining most of the memory.
Focus on optimizing function in the descending order of the resources they use.
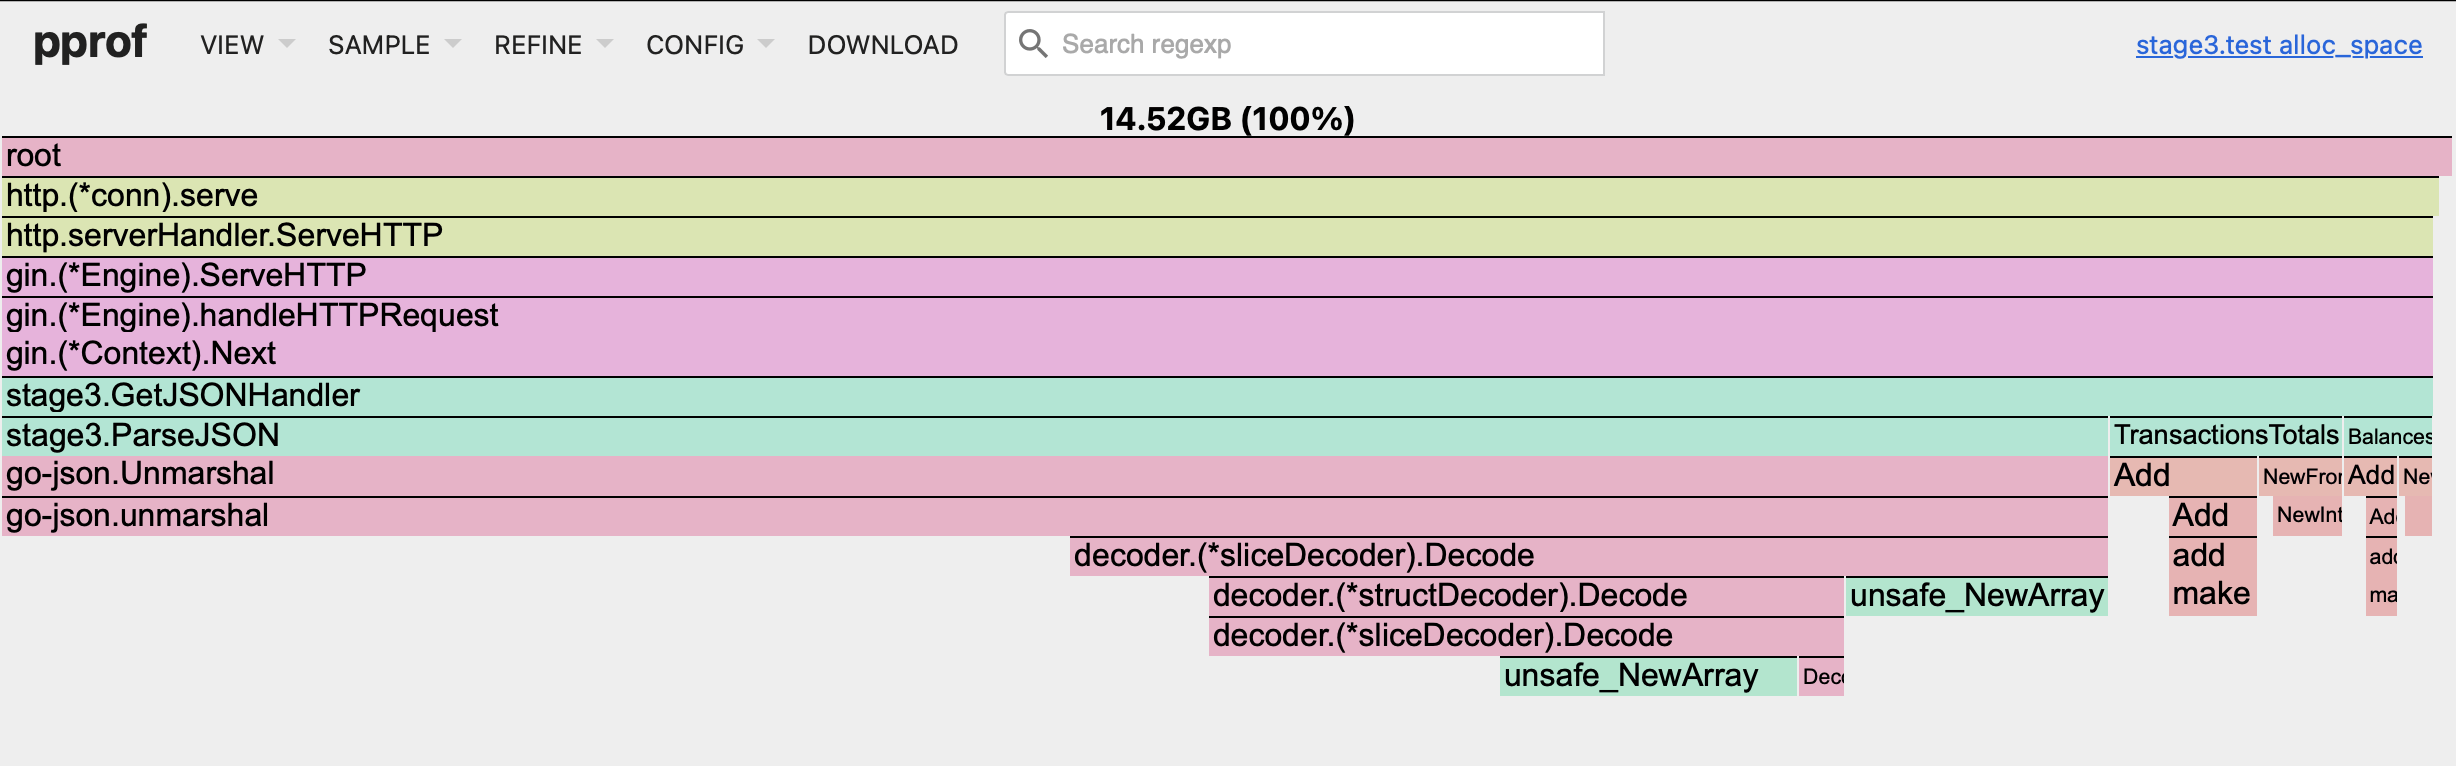
Next, in the "View" section of the menu, choose "Flame Graph" view. The default graph was great, but I prefer to use "Flame Graph" here (I found it more compact and readable).
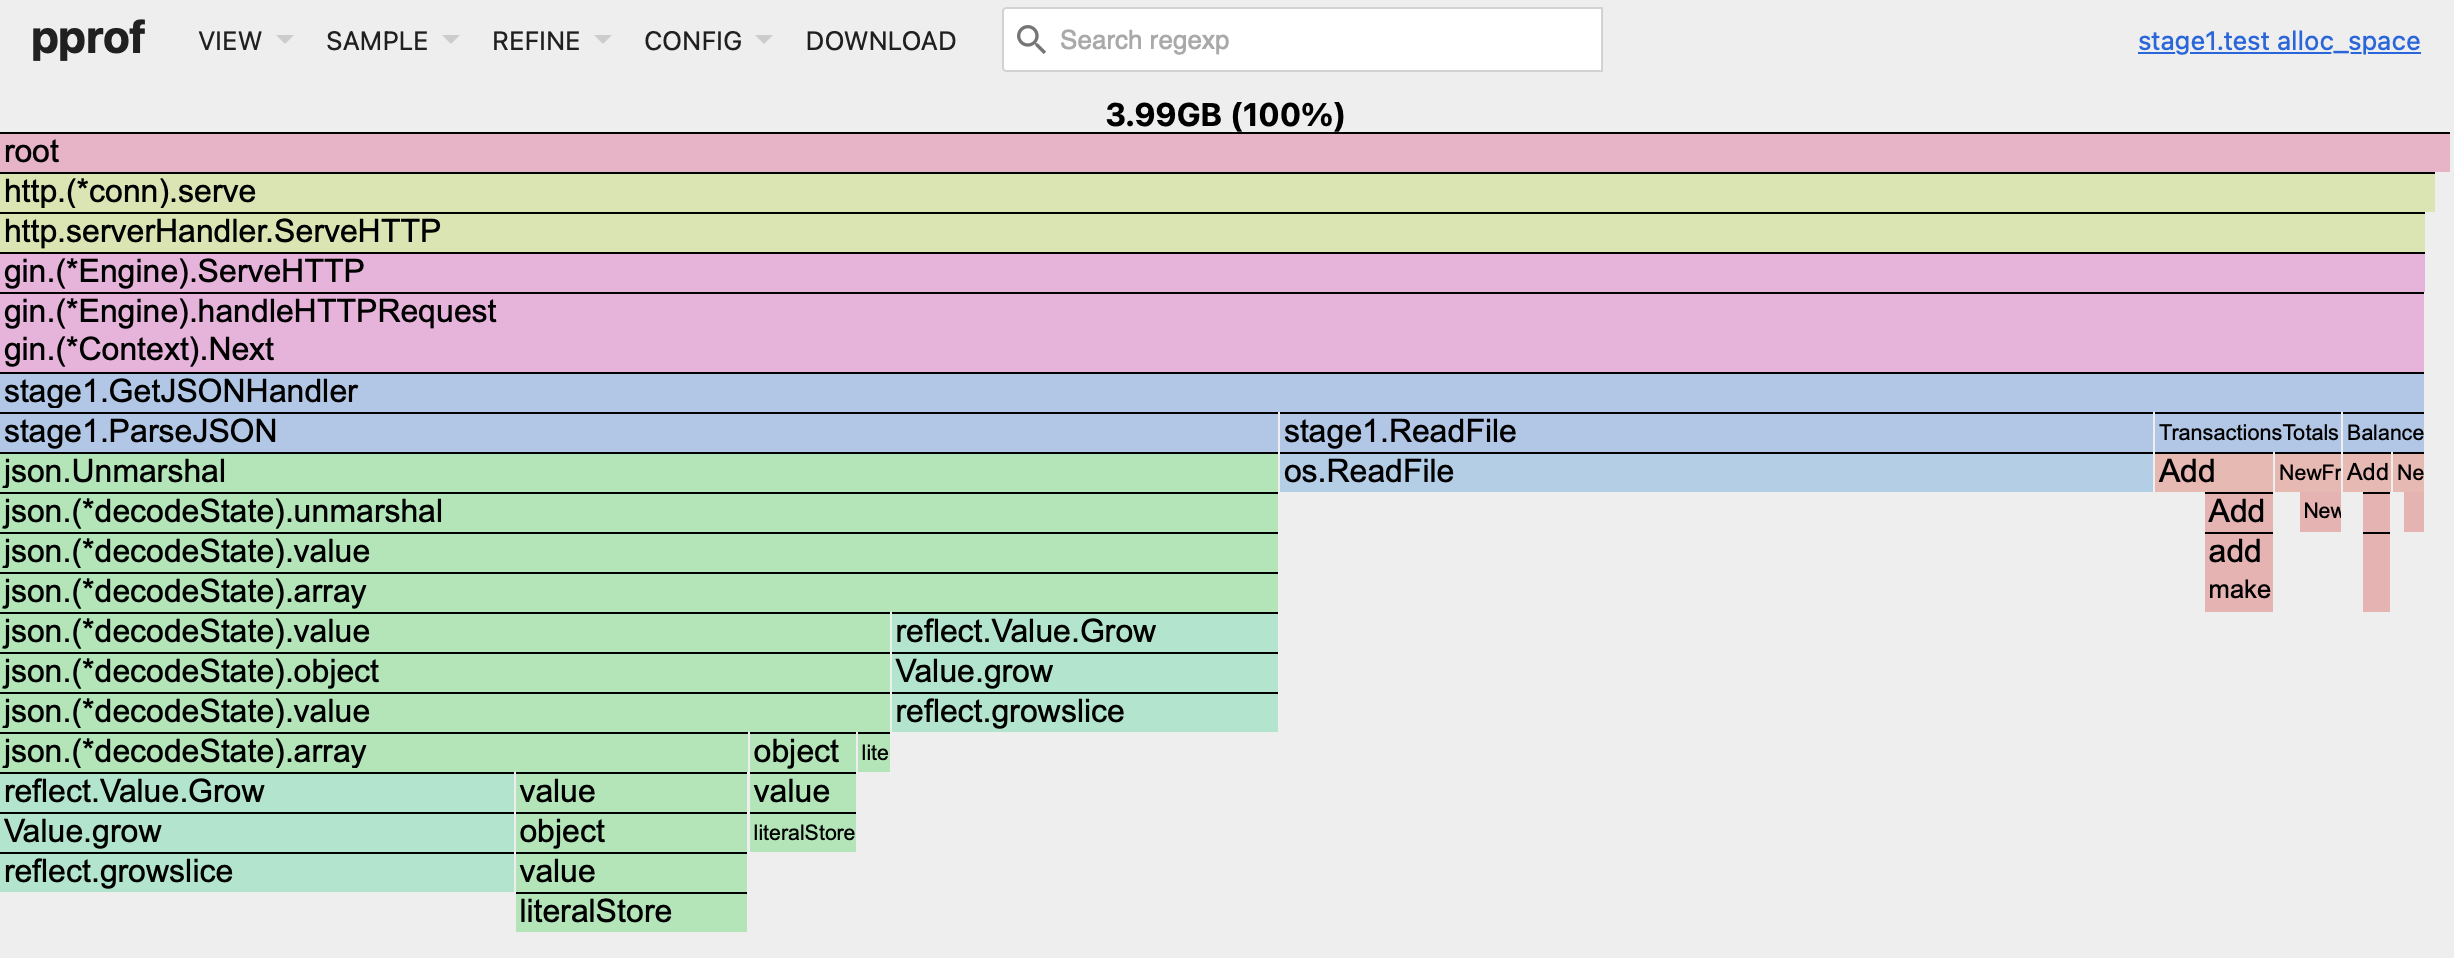
You have probably noticed an alarming memory usage value, almost 4 GB in our case! Oh, that's a lot! But don't be frightened, it is not a constant RAM pressure.
The pprof tool in Go provides a visualization of the memory usage of your program. When you see large numbers like 4 GB, it's showing the cumulative size of the objects allocated in your program, not the current memory usage. And, since we were running the command with the -count=10 flag for 1 second each iteration, you see the cumulative size for 10 runs.
The pprof tool records every allocation made by your program. If your program allocates plenty of small objects that are quickly garbage collected, the total size of those allocations can be much larger than the actual memory usage of your program at any given moment.
For example, if your program allocates 1 MB of memory 4000 times, and each time it frees that memory before the next allocation, your program would never use more than 1 MB of memory at a time. However, pprof would report that your program allocated 4 GB of memory.
So, the large numbers you're seeing in pprof are not a measure of your program's memory usage, but rather a measure of its memory allocation. It's a useful tool for identifying parts of your code that are creating a lot of garbage for the garbage collector to clean up, which can slow down your program.
Ok, that was a lot of information. But we are not done, not yet! Remember that we are still having the cpu.pprof to process? Stop the current pprof execution and open the next file:
go tool pprof -http=':8081' cpu.pprof
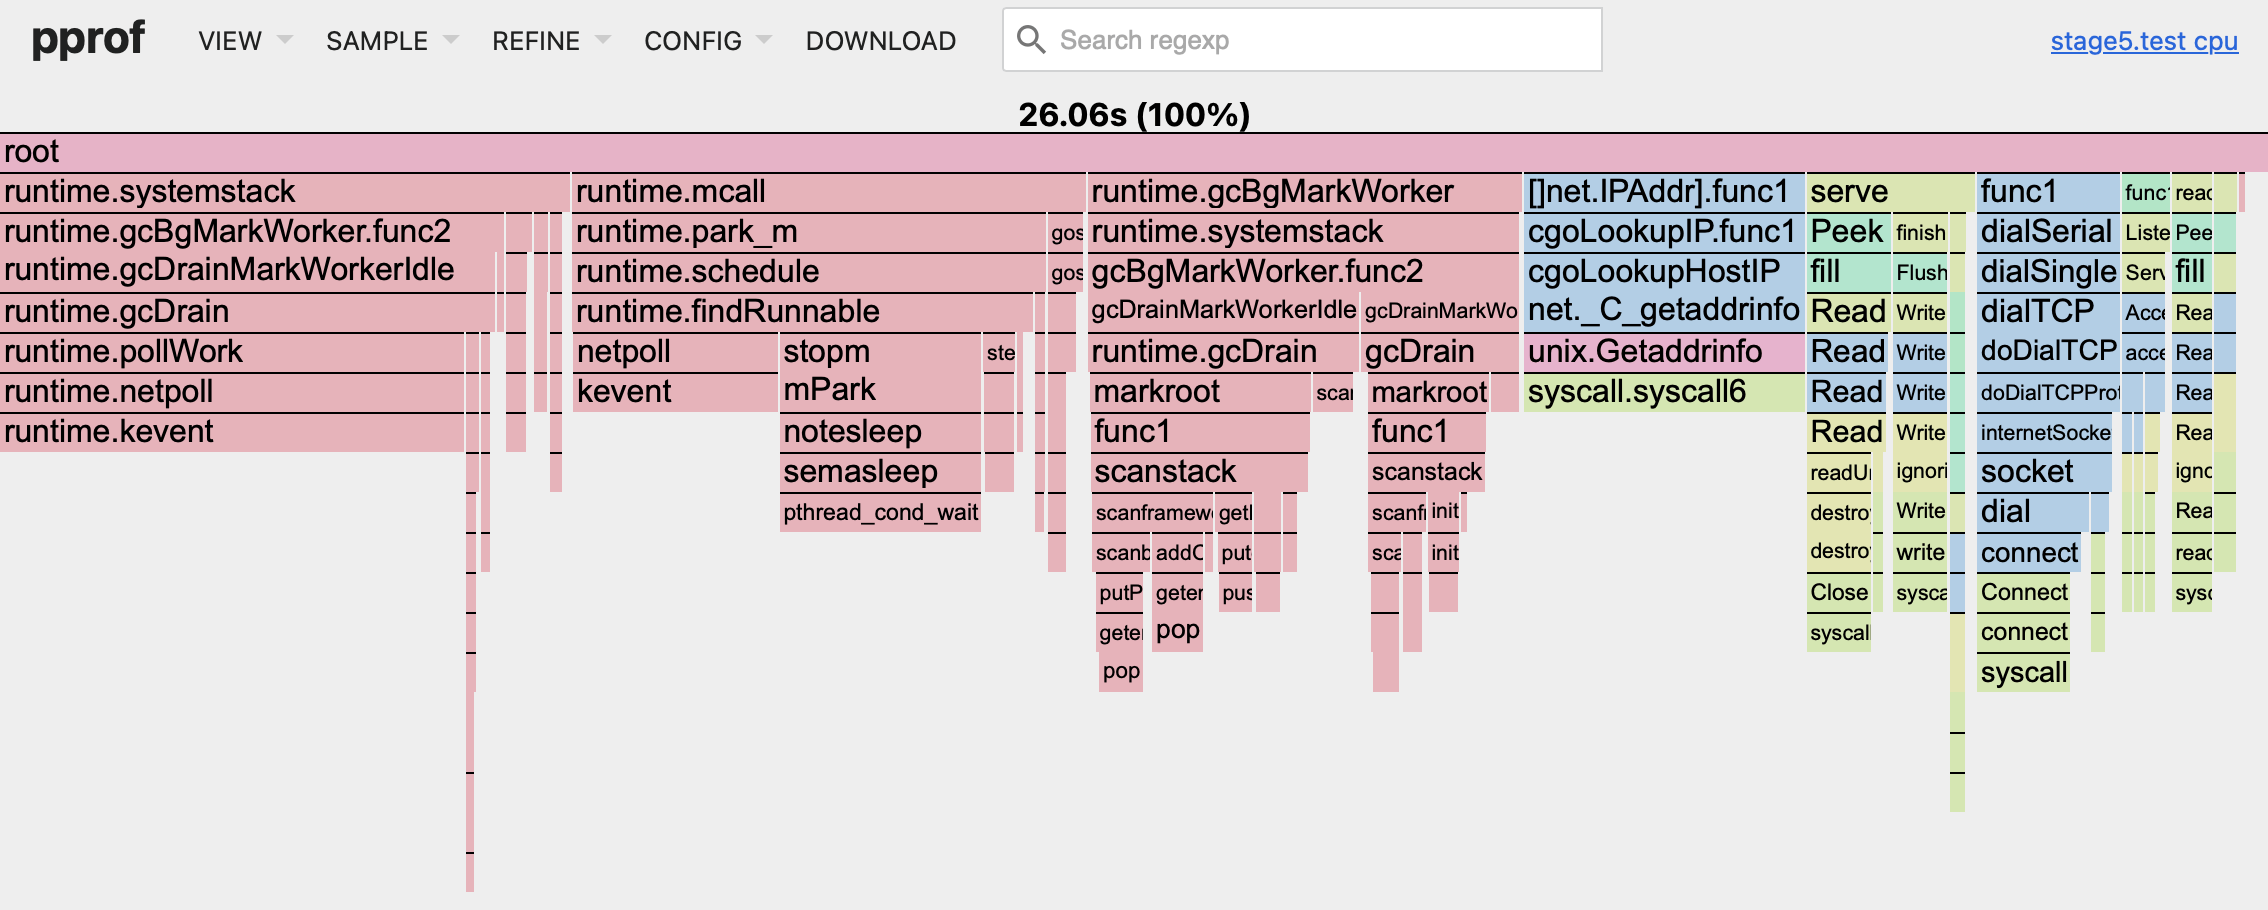
From the first seconds, you can notice that we are having a larger and more complex graph. And you can see that your application was used ~51% of the CPU time… And the rest was utilized by Golang runtime and garbage collector. Let's switch the view to "Flame Graph" to look at our program (the sample setting is "cpu"):
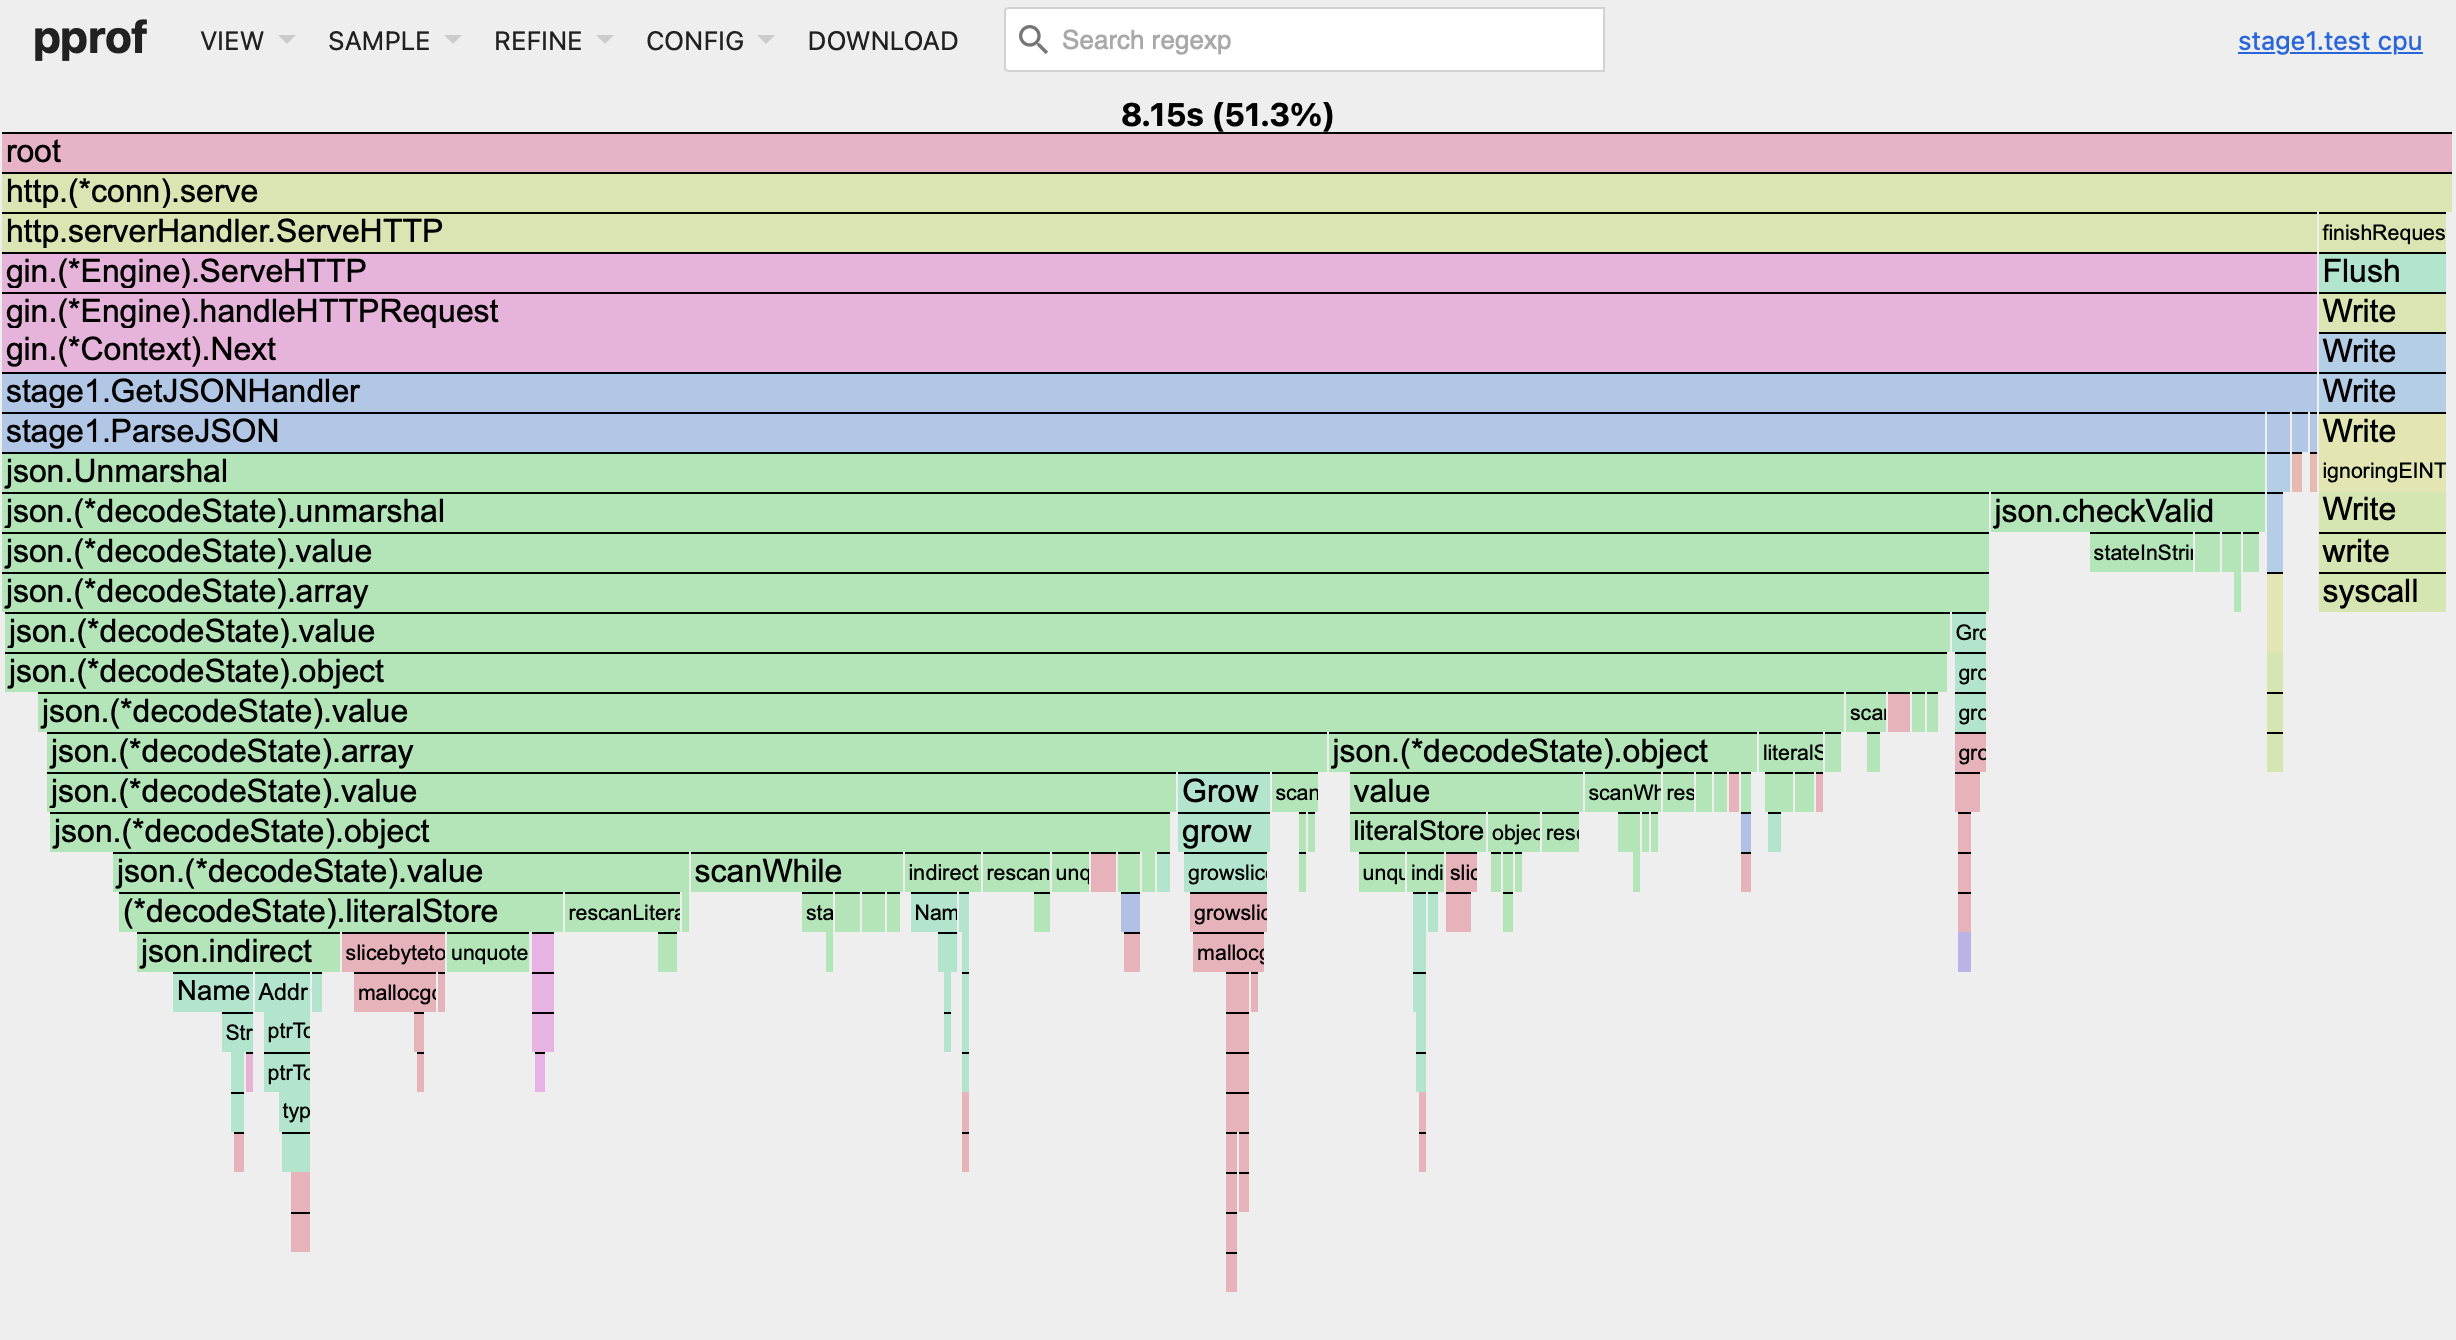
See how it differs from memory usage? Most of the CPU time was utilized on the ParseJSON function. Every other function that we wrote are having so insignificant an impact on the CPU, that we can't even set their names on the chart without clicking on the items. But is it a correct conclusion? No, it is not.
While you can't see ReadFile, BalancesTotals & TransactionsTotals functions here, they are impacting your application performance in the most hidden way: through the runtime and garbage collector (GC). Our root application only occupies about 51**%** of CPU time. Every unnecessary memory allocation in nested loops, pointers misuse, redundant goroutines etc. will lead to pressure on the CPU via the runtime process and GC. It is the rest 49% of our program and there is no easy way to measure the impact here (and some processes we can't control), but we will use this information to compare the impact of our future optimizations.
Stage 2: Optimizing JSON parsing in Golang.
Before we continue, there is something I need you to modify in the go test command. Add at the end of it > stage1.txt to save the output to the text file instead of the console. We will use it later to assess our results between stages.
go test -v -cpuprofile=cpu.pprof -memprofile=mem.pprof -benchmem -bench=. -benchtime=1s -count=10 > stage1.txt
You also will need to install benchstat cmd if you would rather not compare benchmark results manually every single time https://cs.opensource.google/go/x/perf.
go install golang.org/x/perf/cmd/benchstat@latest
From every performance metric that we've seen so far: JSON parsing is our main bottleneck. It is a well-known problem for applications that need to operate under high RPS load. Our first step here is to find a more efficient library to handle JSON tasks. I will save you some time and will go on with go-json, you will only need to replace import. You can also go with sonic library, but its performance is very dependent on the target system.
-import "encoding/json"
+import "github.com/goccy/go-json"
Now it's time to run our performance test for the second time, but this time we will save it into stage2.txt file.
go test -v -cpuprofile=cpu.pprof -memprofile=mem.pprof -benchmem -bench=. -benchtime=1s -count=10 > stage2.txt
Just by looking at the stage2.txt output, I can already tell that we made some huge difference in terms of performance. The number of iterations we were able to perform in one second significantly increased by 3-3.5x times!
BenchmarkServeApp-10   229  4959000 ns/op  6174943 B/op   31765 allocs/op
BenchmarkServeApp-10   247  4957436 ns/op  6168185 B/op   31759 allocs/op
...
It is time to compare results with our new tool. To run the benchstat we only need to provide those files:
benchstat -table .fullname ./stage1/stage1.txt ./stage2/stage2.txt
Now let's look at the results
benchstat -table .fullname ./stage1/stage1.txt ./stage2/stage2.txt
.fullname: ServeApp-10
            │ ./stage1/stage1.txt │         ./stage2/stage2.txt         │
            │       sec/op        │   sec/op     vs base                │
ServeApp-10          15.569m ± 2%   5.221m ± 5%  -66.47% (p=0.000 n=10)

            │ ./stage1/stage1.txt │         ./stage2/stage2.txt          │
            │        B/op         │     B/op      vs base                │
ServeApp-10          4.785Mi ± 0%   5.732Mi ± 3%  +19.77% (p=0.000 n=10)

            │ ./stage1/stage1.txt │         ./stage2/stage2.txt         │
            │      allocs/op      │  allocs/op   vs base                │
ServeApp-10           63.42k ± 0%   31.75k ± 0%  -49.94% (p=0.000 n=10)
The benchmark results show that after replacing the standard JSON decoder with go-json, the execution time per operation (sec/op) decreased by approximately 66.47%, indicating a significant improvement in performance. However, the memory usage per operation (B/op) increased by about 19.77%, and the number of allocations per operation (allocs/op) decreased by nearly 49.94%, suggesting that while the operation became faster, it also became slightly more memory-intensive.
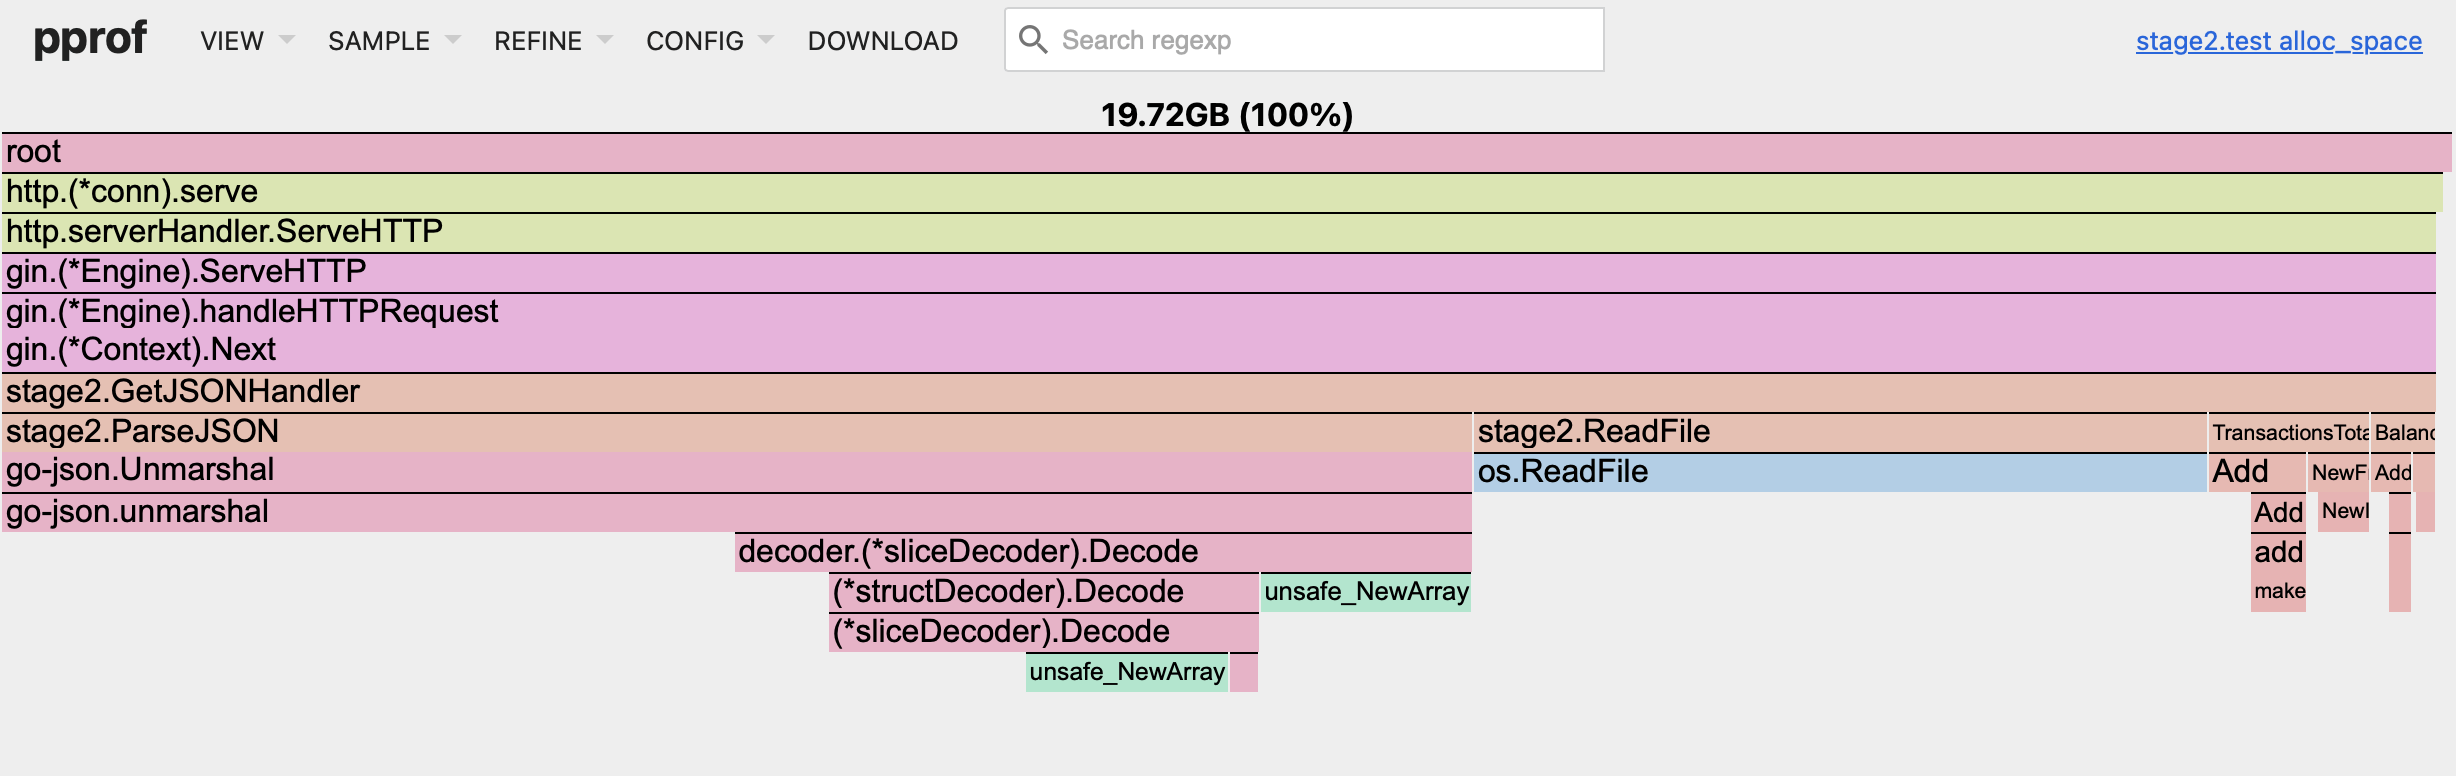
After looking at the updated pprof flame graph, you can see that ParseJSON function still takes up a lot of space here. You can also notice that the total cumulative memory usage skyrocketed from 4 GB to almost 20 GB! But keep in mind, that we were able to increase the number of operations per second by roughly 3 times and, well, B/op is up 19.77%, which was a tradeoff. This explains such a difference in cumulative memory usage.
Overall, this was a giant step in our optimization journey! Let's continue forward.
Stage 3: Optimizing ReadFile operation.
Our next step is to increase ReadFile performance. Instead of relying on os.ReadFile we can use the built-in bufio package. Buffio implements a buffered reader and writer of the same interface.
func ReadFile(filePath string) (io.Reader, func()) {
  file, err := os.Open(filePath)
  if err != nil {
    panic(fmt.Errorf("failed to open file: %w", err))
  }

  return bufio.NewReader(file), func() {
    _ = file.Close()
  }
}

func ParseJSON(data io.Reader) []object.User {
  var users []object.User

  if err := json.NewDecoder(data).Decode(&users); err != nil {
    panic(fmt.Errorf("failed to unmarshal JSON: %w", err))
  }

  return users
}

func GetJSONHandler(c *gin.Context) {
  data, cancel := ReadFile("../object/dummy_data.json")

  users := ParseJSON(data)
  // Close the file reader after reading the content.
  // Note: it can be deferred, but it's better to close it as soon as possible.
  cancel()

  ...
}
The primary distinction between buffered I/O and standard I/O lies in how data is processed. Buffered I/O operates by reading or writing data in blocks, rather than handling one byte at a time.
Let's run our tests and compare the results!
BenchmarkServeApp-10     189   5937594 ns/op 4593636 B/op   31772 allocs/op
BenchmarkServeApp-10     190   6154874 ns/op 4559697 B/op   31766 allocs/op
...
We can see that something is not right. The number of iterations decreased (from ~250 in Stage 2 to 190). Next, I will run a benchstat to compare results further:
benchstat -table .fullname ./stage2/stage2.txt ./stage3/stage3.txt
.fullname: ServeApp-10
            │ ./stage2/stage2.txt │         ./stage3/stage3.txt         │
            │       sec/op        │   sec/op     vs base                │
ServeApp-10           4.795m ± 2%   6.155m ± 3%  +28.37% (p=0.000 n=10)

            │ ./stage2/stage2.txt │         ./stage3/stage3.txt          │
            │        B/op         │     B/op      vs base                │
ServeApp-10          5.699Mi ± 2%   4.235Mi ± 3%  -25.70% (p=0.000 n=10)

            │ ./stage2/stage2.txt │        ./stage3/stage3.txt         │
            │      allocs/op      │  allocs/op   vs base               │
ServeApp-10           31.75k ± 0%   31.76k ± 0%  +0.04% (p=0.012 n=10)
The execution time per operation (sec/op) increased by 28% (this explains the significant drop in iterations), however, the memory usage per operation (B/op) decreased by almost the same amount! So we are using less memory, but need more CPU to achieve this.
What we have learned here is that each optimization has its own drawbacks. You need to consider what you are trying to achieve - whether it's speeding up your application or increasing its performance. These objectives do not always go hand in hand.
I will continue to focus on speeding up the application here, so we should devise a different approach suitable for our case. Since we are consistently serving only one file, and it remains intact at all times, we can cache it.
The best approach here will be to use sync.Once struct from the standard package. It will ensure that ReadFile saves the data just once.
var (
  once    sync.Once
  content []byte
)

func ReadFile(filePath string) []byte {
    once.Do(func() {
        var err error
        content, err = os.ReadFile(filePath)
        if err != nil {
            panic(fmt.Errorf("failed to read file: %w", err))
        }
    })
    return content
}
Neat and simple. We should run our benchmarks to see the impact:
BenchmarkServeApp-10     280   4208854 ns/op 4188958 B/op   31745 allocs/op
BenchmarkServeApp-10     286   4146523 ns/op 4165174 B/op   31741 allocs/op
...
OK, that was better, really better! The number of iterations increased from Stage 2 by about 10-12%. Let's look at the benchstat as we did before:
benchstat -table .fullname ./stage2/stage2.txt ./stage3/stage3.txt
.fullname: ServeApp-10
            │ ./stage2/stage2.txt │        ./stage3/stage3.txt         │
            │       sec/op        │   sec/op     vs base               │
ServeApp-10           4.795m ± 2%   4.329m ± 3%  -9.71% (p=0.000 n=10)

            │ ./stage2/stage2.txt │         ./stage3/stage3.txt          │
            │        B/op         │     B/op      vs base                │
ServeApp-10          5.699Mi ± 2%   3.928Mi ± 2%  -31.07% (p=0.000 n=10)

            │ ./stage2/stage2.txt │        ./stage3/stage3.txt         │
            │      allocs/op      │  allocs/op   vs base               │
ServeApp-10           31.75k ± 0%   31.74k ± 0%  -0.03% (p=0.000 n=10)
After caching the file, the benchmarking results show a significant performance improvement. The operation time decreased by approximately 9.71%, the memory usage declined by around 31.07%, and the number of allocations per operation remained almost the same.
Now you can't even find the ReadFile function from the pprof UI! Furthermore, good to mention that the total cumulative memory usage has noticeably reduced from 20 GB to 15 GB. I'm pleased with the results and will continue further!
Stage 4: Pointers & Loops.
I think that the optimizations described in this chapter were the most obvious from the start. The first reason I kept them for so long is that you are most likely to use pointers automatically and can spot unnecessary loops on your own. The second reason is that while this approach matters, it will only help us just a tiny bit in comparison with the previous things.
I will change 3 things in the code:
- Replace all
[]object.Userwith[]*object.User. If you are new to this, you might want to do something like*[], but it will make things worse in any use case. Copying pointers is a cheap operation. - Combine
BalancesTotals&TransactionsTotalsinto one function to remove redundant loops. Sidenote: you can also flatten the data, so you can remove a nested loop, but that will require a bit more time to cook. - Count transactions with
len()
I think that is enough of the code being shown here already. If you're interested, you can see the full example in the GitHub repository: samgozman/golang-optimization-stages/tree/main/stage3. Let's move to benchmarking once again…
BenchmarkServeApp-10     277   3953330 ns/op 3697193 B/op   31744 allocs/op
BenchmarkServeApp-10     306   3929780 ns/op 3693402 B/op   31739 allocs/op
...
Just a slight difference, benchstat will show us a bit more:
benchstat -table .fullname ./stage3/stage3.txt ./stage4/stage4.txt
.fullname: ServeApp-10
            │ ./stage3/stage3.txt │      ./stage4/stage4.txt      │
            │       sec/op        │   sec/op     vs base          │
ServeApp-10           4.329m ± 3%   4.264m ± 7%  ~ (p=0.684 n=10)

            │ ./stage3/stage3.txt │         ./stage4/stage4.txt          │
            │        B/op         │     B/op      vs base                │
ServeApp-10          3.928Mi ± 2%   3.519Mi ± 0%  -10.42% (p=0.000 n=10)

            │ ./stage3/stage3.txt │      ./stage4/stage4.txt      │
            │      allocs/op      │  allocs/op   vs base          │
ServeApp-10           31.74k ± 0%   31.73k ± 0%  ~ (p=0.467 n=10)
The memory usage declined by 10% from the previous iteration, everything else is the same. Most of the impact here comes from switching to pointers, the loop optimization hasn't affected the performance much.
Stage 5: Cache Cheating.
And now it is the time for a little cheat which is only applicable to our code example! Remember that our router only serves one file every single time? It is not that uncommon, especially if your server does the job of serving front-end texts. In Stage 3 I introduced sync.Once for the ReadFile function. But we can use it for the whole handler logic!
var (
  once     sync.Once
  response gin.H
)

func GetJSONHandler(c *gin.Context) {
  once.Do(func() {
    // 1. Read the content of the file dummy_data.json
    data := ReadFile("../object/dummy_data.json")

    // 2. Return a JSON response with a message
    users := ParseJSON(data)

    // 3. Calculate the total balances and transactions
    currents, pendings, transactionsSum, transactionsCount := GetTotals(users)

    response = gin.H{
      "current":            currents.String(),
      "pending":            pendings.String(),
      "transactions_sum":   transactionsSum.String(),
      "transactions_count": transactionsCount,
    }
  })

  c.JSON(200, response)
}
I have moved once.Do from ReadFile into GetJSONHandler. Now we only create this response once, which makes all our previous optimizations kinda useless. But I wanted to show them because this particular cheat can only be used in some very specific examples. In more complicated scenarios, you will probably cache responses in some Redis-like key-value storage via router middleware. Nevertheless, the global idea is the same: use cache.
BenchmarkServeApp-10    3146    466019 ns/op   24553 B/op     174 allocs/op
BenchmarkServeApp-10    2426    511220 ns/op   22710 B/op     171 allocs/op
...
Astonishing results!
benchstat -table .fullname ./stage4/stage4.txt ./stage5/stage5.txt
.fullname: ServeApp-10
            │ ./stage4/stage4.txt │          ./stage5/stage5.txt          │
            │       sec/op        │    sec/op      vs base                │
ServeApp-10          4264.5µ ± 7%   805.6µ ± 340%  -81.11% (p=0.000 n=10)

            │ ./stage4/stage4.txt │          ./stage5/stage5.txt          │
            │        B/op         │     B/op       vs base                │
ServeApp-10        3603.50Ki ± 0%   27.12Ki ± 12%  -99.25% (p=0.000 n=10)

            │ ./stage4/stage4.txt │        ./stage5/stage5.txt         │
            │      allocs/op      │ allocs/op   vs base                │
ServeApp-10          31733.5 ± 0%   174.0 ± 5%  -99.45% (p=0.000 n=10)
Now this router barely uses anything, it is just crazy! Yes, it is cheating, but the legal one in the case of this example. I suggest to look at our alloc_space graph for the last time, just for fun:
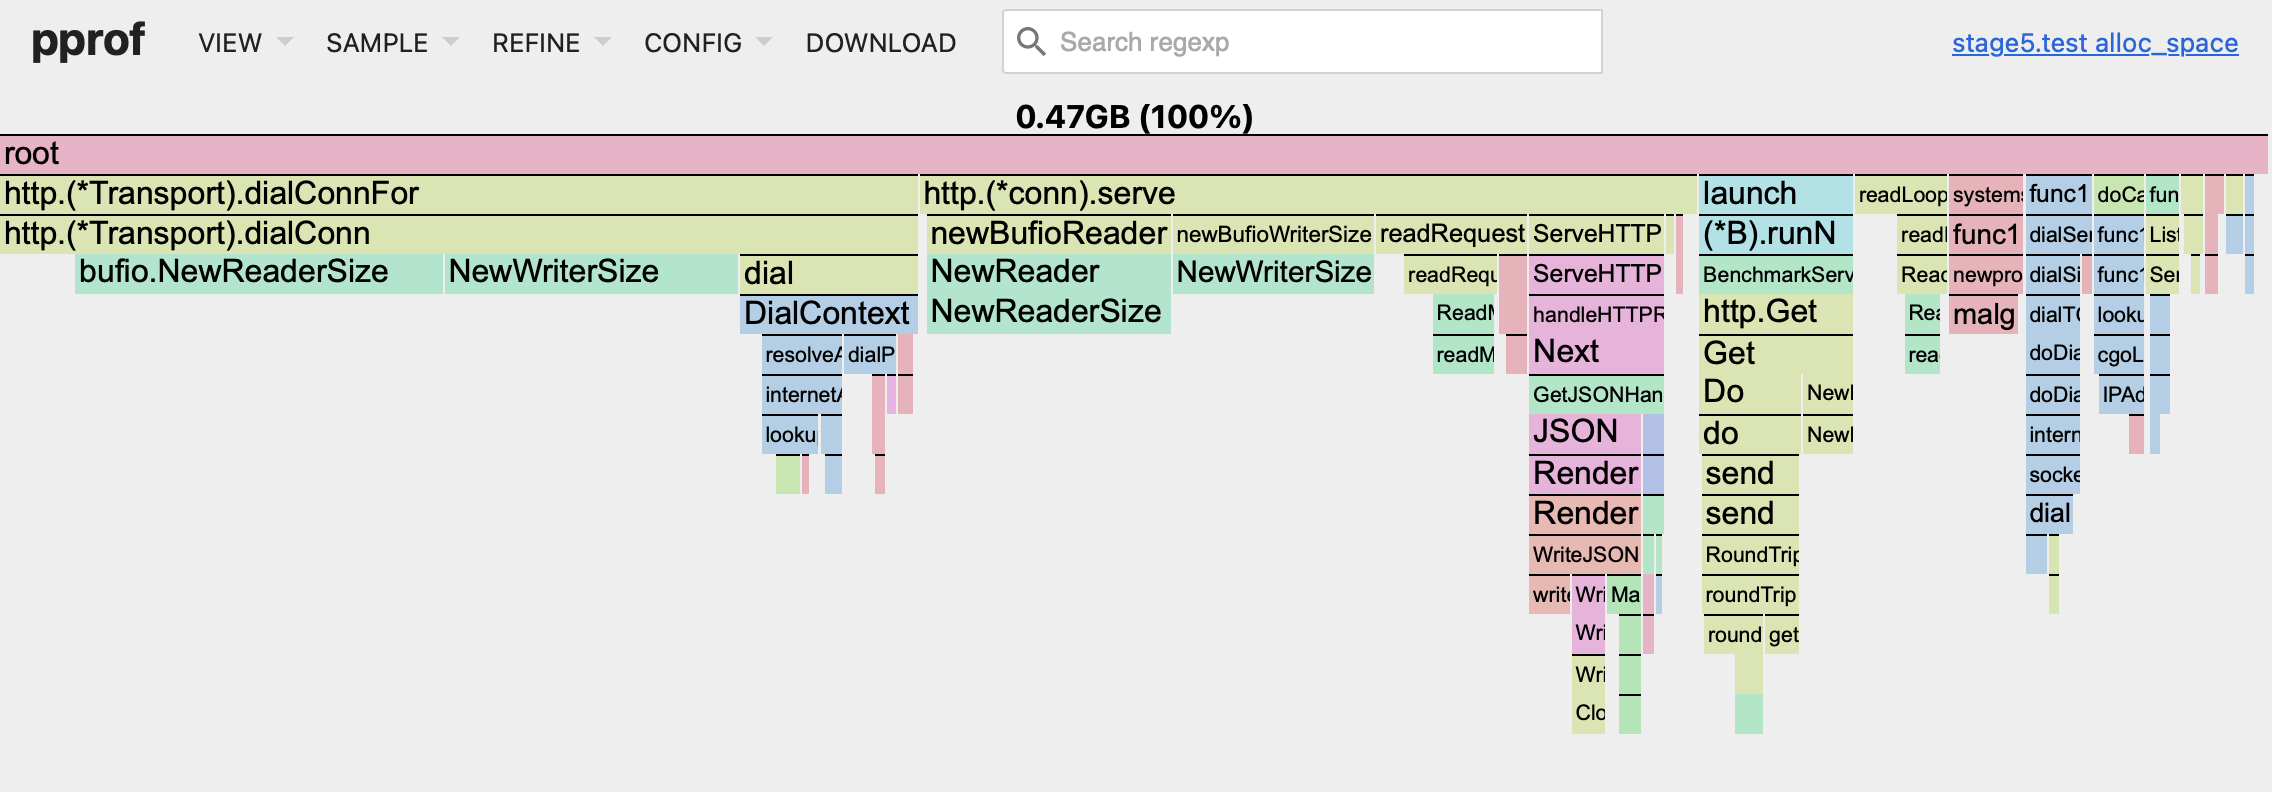
It is difficult to notice any function on this graph that we've been optimizing for all this time! The total cumulative memory usage is now 1/8 of its original value. The same applies to the CPU profile as well.
Summary.
It was too much information for one blog post, but I'm glad I didn't split it in half! We moved from our first naive approach, which could hold up to 78 requests per second, to the optimal approach in stage 4 which helped to increase RPS up to 279 on average. And in stage 5 we've used some illegal cache cheating to move the plank even higher to up to 1487 RPS.
Everything that we've covered here is about how to approach the optimization process, what steps to take, and how to use pprof and benchmarks in Golang.
Some tips and notes:
- Never engage in premature optimizations
- Read more about
pprofin the README file: github.com/google/pprof - You can optimize work with large objects by using
sync.Poolmethod. It has its drawbacks, but will help to reduce the number of allocations in some cases - The
sync.Oncefunction will lead us to the usage of global variables, which is an antipattern in most languages. Use this thing wisely and never export those variables to the outside - If you want to bench some part of the application inside the test, be sure not to use any mocks in it, as it will lead to some troubles:
testing.Binterface is not expected by most mocking techniques (testing.T) - If your benchmark setup process takes significant time before the actual testing - use
b.ResetTimer()function to reset timer statistics - Use
net/http/pprofpackage to runpprofAPI alongside your application (this can help to "debug" some problems on production) - When optimizing your code, strive not to sacrifice readability
I hope you found this information useful and see you in the next post! Subscribe for future updates :)
6 May
2024